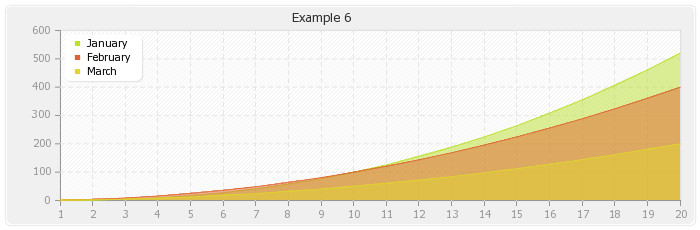
Example #6 - Creating a filled line graph with transparency
This example shows how to create a simple line graph containing 3 data series. The graph function
called is
drawFilledLineGraph() specifying
a transparency factor of 50%. Running this script will create a
example6.png file in the current directory.
Output :
|
 |
Note on the dataset |
Data are retrieved from a CSV file named
datawithtitle.csv. This file contains 4 colums : Column 0 is used
as index, Column 1-2-3 are used as data series. This file does contains a header defining series name.
Click here to download datawithtitle.csv
Source code :
 <?php
  // Standard inclusions
  include("pChart/pData.class");
  include("pChart/pChart.class");

  // Dataset definition
  $DataSet = new pData;
  $DataSet->ImportFromCSV("Sample/datawithtitle.csv",",",array(1,2,3),TRUE,0);
  $DataSet->AddAllSeries();
  $DataSet->SetAbsciseLabelSerie();

  // Initialise the graph
  $Test = new pChart(700,230);
  $Test->setFontProperties("Fonts/tahoma.ttf",8);
  $Test->setGraphArea(60,30,680,200);
  $Test->drawFilledRoundedRectangle(7,7,693,223,5,240,240,240);
  $Test->drawRoundedRectangle(5,5,695,225,5,230,230,230);
  $Test->drawGraphArea(255,255,255,TRUE);
  $Test->drawScale($DataSet->GetData(),$DataSet->GetDataDescription(),SCALE_NORMAL,150,150,150,TRUE,0,2);
  $Test->drawGrid(4,TRUE,230,230,230,50);

  // Draw the 0 line
  $Test->setFontProperties("Fonts/tahoma.ttf",6);
  $Test->drawTreshold(0,143,55,72,TRUE,TRUE);

  // Draw the filled line graph
  $Test->drawFilledLineGraph($DataSet->GetData(),$DataSet->GetDataDescription(),50,TRUE);

  // Finish the graph
  $Test->setFontProperties("Fonts/tahoma.ttf",8);
  $Test->drawLegend(65,35,$DataSet->GetDataDescription(),255,255,255);
  $Test->setFontProperties("Fonts/tahoma.ttf",10);
  $Test->drawTitle(60,22,"Example 6",50,50,50,585);
  $Test->Render("example6.png");
 ?>
|
 |
If you want to send the picture directly in a browser, replace the Render() command by Stroke(). |
|
 |
Last updated on 05/16/2008 |